
College Football Picks & Best Bets Against The Spread
At ATS.io, we provide expert College Football Picks for the 2025-26 season, covering every matchup from kickoff to the College Football Playoff. Backed by decades of sports betting experience, our trusted analysts deliver data-driven predictions against the spread, on moneylines, and for totals, helping bettors make smarter, more informed wagers every week.
Best Bets For Today
-

 2025 Heisman Trophy Betting Odds & Futures Preview & Prediction
 -
 College Football Best Bets: College Football Playoff Championship Picks & Predictions
 -

-
 Best College Football Parlay Picks: College Football Playoff Semifinal Parlays
 -
 College Football Underdog Fantasy Picks This Week: College Football Playoff DFS Picks
College Football Games
- MLB
Free College Football ATS Picks & Predictions
Free College Football ATS Picks & Predictions


College Football Futures
About ATS.io College Football
When it comes to finding the best free college football prediction site, ATS.io stands out as a top choice. At ATS.io, we provide a comprehensive analysis of today’s college football games, offering free NCAAF picks backed by detailed insights. Our picks come complete with key statistics, trends, and the rationale behind our selections. Whether you’re looking for expert guidance or simply want to stay updated on top college football picks, be sure to visit ATS.io regularly throughout the season.
College Football Betting
College football betting is extremely popular in the United States. It probably falls third behind the NFL and the NBA in terms of popularity, but don’t tell that to the college football fanatics that live and die with each and every game on the Saturday card.
The betting options for college football, sometimes abbreviated NCAAF or CFB, are similar to those of professional football. You’ll find spreads, totals, money lines, teasers, parlays, derivative (half & quarter), props, and live betting options listed at your preferred sportsbook.
Teasers and money line wagering are far less popular with college football compared to the NFL because of the higher level of variance in the sport and the larger talent gaps, but those options are still available to you if you wish to use them.
Using a live odds screen like ours at ATS is critically important for college football because there are a ton of games on Saturdays. Unlike the NFL, which plays no more than 13 games on Sunday except for Week 17, there are upwards of 50+ college football games on Saturdays and more in non-conference play. It is important to check the odds and keep everything square.
College Football Betting Odds Explained
You can bet on College football in many different ways, which means you will find a number of different lines and odds for every market. Therefore, it is imperative to your CFB betting success that you understand these odds before every bet you place.
In theory, odds are set to level the proverbial playing field between the two sides of a game. This is especially important in college football considering the immense number of mismatches you will find on the weekly slate.
Odds are predetermined by the oddsmaker according to each side’s implied probability of winning. When you read odds, you will see a favorite and an underdog. While the favorite will normally have minus odds, the underdog will have plus odds.
Furthermore, there will also be times when the oddsmaker determines that both sides have an equal chance of winning. When this happens, you will find a pick’em bet.
Below, you will find all of the most basic CFB betting types explained with examples of how to read their lines and odds.
How To Bet On College Football
There are numerous ways to bet on college football, which is why sports betting is enticing for both new and experienced bettors. While you will find your traditional wagers like the moneyline, the point spread, and the over/under total bets, there is a slew of more complex ways to bet on CFB like the prop bet, the parlay bet and the futures bet.
When it comes to betting on college football, there are three fundamental options: point spread, moneyline, and Over/Under (also known as the total).
- Point Spread: Betting on the point spread involves predicting how many points one team will win or lose by. This method adds excitement to games with uneven matchups.
- Moneyline: Betting the moneyline is a straightforward choice where you simply pick the team you believe will win the game outright, regardless of the margin of victory.
- Over/Under (Total): The Over/Under bet involves wagering on whether the combined score of both teams will be over or under a predetermined number set by oddsmakers.
Point Spread
College football spread bets are slightly more complex than moneylines but are still considered a traditional betting type.
With point spread bets, you are betting on one side’s margin of victory or defeat against their opponent.
- Missouri +10.5 (-110) at Florida -10.5 (-110)
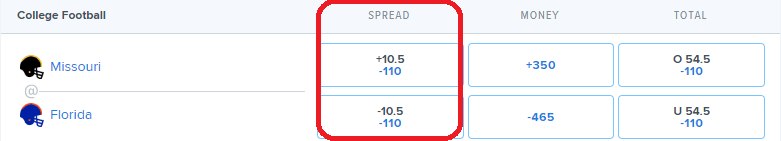
In the example above, Florida is the heavy favorite as they are giving 10.5 points to Missouri. This means that if you bet on Florida to cover the spread, they must win the game by at least 11 points to win your bet.
If you bet on Missouri to cover, they can either win the game outright or lose by fewer than 11 points to cash your point spread bet.
Moneylines
College football moneylines are the most simplistic ways to bet on CFB. When you place a moneyline wager, you are making an outright bet. This means that you are betting on one side to defeat the other straight up, with no points involved or spreads to cover.
- SMU -146 at Central Florida +122
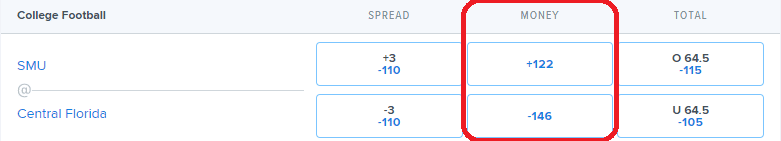
In the above example, Central Florida is the betting favorite, signified with -146 odds while SMU is the underdog with +122 odds.
Your moneyline betting ticket will cash if the team you bet on wins the game outright.
Totals Bets (Over/Under)
College football totals bets are also called over/under wagers. When you make a totals bet, you are betting on the final score of the game to go over or under a predetermined number set by the oddsmakers.
This number is based on the implied probability of the number of points expected to be scored in a game by both teams combined.
- UNLV @ San Jose St
- O 51.5 (-110)
- U 51.5 (-110)
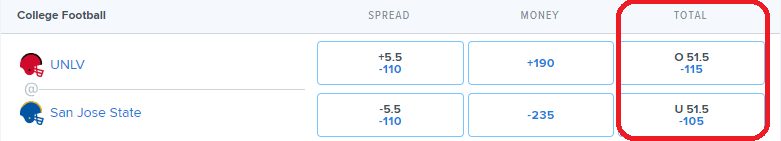
In this example, there are 51.5 points expected to be scored in the UNLV-San Jose St game. If you bet on the over, there must be 52 combined points scored by both teams for you to win your bet. However, when you take the under, the combined points must fall at 51 points for fewer for your ticket to cash.
Other Ways To Bet On College Football
Prop Betting
College football prop betting is considered the most fun way to bet on CFB markets. Also called proposition bets, when you bet on a prop bet, you are betting on an outcome that is not directly correlated to the final score or the overall outcome of a game.
There are three primary forms of prop betting. Here are what they are some examples.
- Game Props: Game props are based on a unique occurrence during a game.
- Halftime/full-time result.
- Team Props: Team props are based on an individual team’s performance during a game.
- Who will score 15 points first (also called Race to 10, 15, 20, etc)
- Player Props: Player props are based on an individual player’s performance in a statistical category.
- Anytime touchdown scorer.
- Exotic Props: Exotic props are a fourth prop betting type that is rarer than not. These props are found around events of great magnitude like the CFB National Championship, Match Madness, and the Super Bowl. Exotic props are normally focused on happenings around an event and not so much on the game itself.
- Length of the National Anthem.
Parlay Betting
College football parlay betting is one single bet made up of two or more individual bet selections. Each bet selection inside of a parlay is called a leg. To win your parlay bet, all of the legs of your parlay must be successful. If one of those legs is graded as a loss, the entire parlay betting ticket will be settled as a loss.
Although parlays are difficult to win, bettors enjoy them since they can win a larger payout while risking less.
- Pittsburgh +7.5 (-110)
- Georgian -850
- Utah -2.5 (-110)
- Florida State +136
Odds: +861
In the above parlay, you can get a $480.66 payout on a $50 stake if all of the legs of your parlay settle as winners.
Futures Betting
College football futures betting allows you to bet on the future outcome of a particular event. These bets will not settle until the conclusion of the event you bet on, even if it is, for example, 10+ months away.
- FBS National Championship Winner
- Heisman Trophy Winner
- Team versus the Field Bets
Top 3 Sportsbooks for College Football Betting
BetMGM
One of the best online sportsbooks for college football betting is BetMGM Online Sportsbook. Not only will they offer just about every CFB game to bet on including the obscure smaller schools, but BetMGM will also feature a slew of different betting options including one-game parlays.
In addition to layers of betting markets, you will also find attainable rewards programs for loyal customers to go along with terrific bonuses and promos for new and existing users. Some of these promos will even be catered to CFB markets like CFB one-game parlay insurance, odds boosts, and bet and gets.
Caesars Sportsbook
Another one of the best college football betting apps is Caesars Sportsbook. Formerly the esteemed William Hill Sportsbook, Caesars Sportsbook is now a part of the Caesars Entertainment brand, one of the powerhouses in the gambling space.
At Caesars Sportsbook, you will be hard-pressed to find a CFB market that they do not offer. Furthermore, this heavy-hitting operator will also offer some of the most competitive lines and odds that you will find.
At any given time, Caesars Sportsbook will offer lucrative bonuses and promos for CFB betting markets like the profit boost token that could get you a 25% profit boost on select games. You will also find free bet offers and parlay insurance. All of these will benefit your bankroll in one way or another.
DraftKings Sportsbook
You’d have to be living under a rock to not know DraftKings Sportsbook. Offering tons of CFB games to bet on and ample bet types to bet on them with, in addition to its competitive lines and odds, DraftKings Sportsbook is a mainstay in the CFB betting space.
When you are big as DraftKings Sportsbook, you have the ability to offer lucrative bankroll bolstering bonuses and promos for both new and existing users. While new users can get $200 in free bets just for betting $5 on a CFB market, existing users can also take advantage of offers like profit boosts, bet and gets, odds surges, and daily DK Specials.
Why Should I bet CFB on Legal Betting Sites?
For many years, if you wanted to bet on football online, you had no choice but to use an offshore betting site. However, that is no longer the case now that mobile sports betting is legal in the United States.
When you bet on a legal sportsbook, you will be protected by United States and individual state betting laws and regulations. Meanwhile, offshore sites are unregulated. With unregulated sites, you are not protected. First and foremost, when it comes to your money. While it is easy to make a deposit, offshore sportsbooks could make it difficult to make a withdrawal, especially if you are a successful bettor.
For example, you can not turn to your federal or state government if an offshore sportsbook decides not to give you your deposit or if all of a sudden your bankroll disappears. These sportsbooks could also fold with no questions asked, leaving you and your funds in the dust.
Therefore, if you live in a state with legal mobile sportsbooks, it is always the best choice to bet on that platform versus the offshore site.
Differences Between College Football Betting From NFL Betting
While when betting on College or the NFL, you are betting on football, there are several primary differences between wagering on the two powerhouse betting markets.
Player Movements and Familiarity
There are only 32 teams in the NFL with 53 players on an active roster at a given time. In College, the FBS alone features 128 teams with a total of 105 players (not always active on gameday). With so many players, it is difficult to handicap and project a game for College bettors.
There are some college teams that are three-deep at quarterback and could make a change at any time. Then, you could be getting a signal caller with lesser experience than anticipated, which could lead to a disaster on the field.
What if you place a bet on Colorado thinking their normal quarterback will get the start, then all of a sudden they change to the backup? The bet you made would be in jeopardy. This is less likely to happen in the NFL barring injury, of course.
Player Props
With NFL betting, you will find player props for all of the top players in every game. You will even find these prop markets for notable backups as well. This is because there are fewer players in the NFL player pool.
And while you will still find player props in CFB betting, you will have fewer choices in players and statical prop type as well. You will also find the bulk of the CFB player props attached to the more notable teams (Top 25) and the games they are involved in.
Number Of Games
Since there are only 32 NFL teams, you will get a maximum of 16 games to bet on in a given slate. Even less when NFL bye weeks hit. Meanwhile, there could be in excess of 40 games to bet on in a CFB slate since there are so many teams. Think of it like soccer betting.
On a Saturday soccer slate, there could be 70 matches happening at once, making it a nightmare to narrow down the match you want to bet on. And we didn’t even get into handicapping the matches yet. This is similar to CFB.
NFL betting is much easier than CFB betting, especially for the novice bettor. Fewer games and a higher quality of players will equate to a more straightforward market to handicap.
Pros Versus Students
When you bet on NFL games, you are betting on professional players, which means they are playing for a roster spot, their job, and their livelihood. Meanwhile, when betting on CFB, you are betting on students whose professional future in the sport is unlikely for the greater populous.
These students have to worry about passing classes and getting their degrees for their future, which equates to lesser practice time. This is significant because college teams are not as crisp as NFL clubs. They are sloppier, making the games more difficult to handicap.
College Football Betting Basic Strategies
Every successful sports bettor goes into every bet they make with an actionable strategy. Below, some of the basics will be discussed to help give you a head start on your sports betting endeavors.
Take Advantage Of Generous Promos
One of the best ways to build your bankroll from the start is by taking advantage of generous welcome promotions offered by all of the top us sportsbooks. While these are general offers, you can use them on College betting markets.
While sportsbooks feature these offers in an attempt to draw new business in a saturated, competitive market, they are there to benefit the bettor, especially, the educated one.
Although you are limited to one sign-up offer per sportsbook, you are not limited to the number of sportsbooks you can sign up for. Therefore, if you live in a state like New Jersey, which has an abundance of sportsbooks with these welcome offers, you can really bolster your bankroll by signing up for five or even 10 different mobile betting sites.
The free money doesnt stop at the welcome offer either. Once you are a part of these sportsbooks, the best ones will always feature recurring bonuses and promotions to existing users as well. Once they get you to sign up, they don’t want you to leave, which again, benefits you.
Line Shopping
When you sign up with multiple sportsbooks to take advantage of welcome offers, it makes it easier for you to go line shopping.
When you are line shopping, you are shopping a market that you want to bet on across multiple sportsbooks, looking for the best odds. Then, when you find the best odds, you will place your bet on the sportsbook offering them.
For example, if BetMGM is offering a market at -125 odds and you find that same market at -120 odds at Caesars Sportsbook, then it would be wise for you to give your business to the latter. Here is why.
When you make a $50 bet on a market with -125 odds, you will get a $112.50 payout. However, your payout will be $110 when you place that same $50 bet on -120 odds, a difference of $2.50.
Although that $2.50 seems like a minuscule number, when you do this over time, that number will grow. If 10 of these bets hit in a month, that is a $25 profit.
If you want to be a profitable sports bettor over time, line shopping is a must.
Be Selective With Bet Selection
As suggested earlier in this guide, there could be in excess of 50 CFB games at a given time on a CFB Saturday slate. Here is some advice, if you are betting them all, you will not be profitable. Therefore, you must be selective in terms of the games you are betting on.
When narrowing down the games to bet on, you should take into consideration two different factors. One, bet the games and the teams that you know the best. You should also find games to bet on that offer value.
If that means that you are only betting on a handful of games on the Saturday slate, then so be it. Doing it this way will put you in a better position to end the slate in the green and not the red.
Track Your Bets
The best sports bettors treat sports betting like a business. And one of the keys to running a successful and profitable business managing your money. In sports betting, this is called bankroll management.
The best way to manage your bankroll is by vigorously tracking every single bet that you make. This way, you know exactly where you are at the end of a betting cycle.
If you are not honestly tracking every bet, you are not being honest with yourself. You may think you are a profitable sports bettor, but unless you are keeping track of your wins, losses, and profitability with every bet you make, you will never truly know the truth.
Tracking your bets is another great way to see what changes need to be made with your approach. You will be able to see and identify trends. You may be stronger with moneylines than totals. After a period, you may want to focus on moneylines and punt totals altogether.
You could also be an outlier and crush parlays or be an ace with quarters betting. The only way to know this is by tracking your bets.
Important Dates for the 2023-2024 College Football Season
The college football season typically commences in late August or early September and runs through January, culminating with the College Football Playoff National Championship game. During this time, most FBS (Football Bowl Subdivision) teams participate in a regular season consisting of approximately 12 games. It’s worth noting that the majority of these games are played against conference opponents, totaling eight or nine matchups within their respective conferences.
- August 24, 2024: College Football Season Starts
- December 14, 2024: College Football Season Ends
- December 20, 2024: College Football Bowl Games begin to be played
- January 1, 2025: This marks the start of the Semifinals of the CFB playoffs (Rose Bowl and Sugar Bowl)
- January 8, 2025: CFB National Championship Game